The Reporting Test: How to Tell if Your Agency’s Results Are Real


In this article
A marketing report can look impressive without telling you much about how your business is doing. I’ve seen reports lead with a great campaign, a strong return on ad spend, or a particularly good month, while leaving out the numbers that would put those results in context.
That doesn’t necessarily mean anyone is lying. But choosing which numbers to show can change the story.
In a 2025 OnePoll survey commissioned by ASK BOSCO, 95% of 100 UK marketing managers said their agency had emphasized positive results while downplaying negative ones. Seventy-five percent said they had fired an agency because of poor reporting.
Similarly, Setup’s Marketing Relationship Survey found that 61% of client respondents cited dissatisfaction with delivery as a reason for ending an agency relationship. Another 61% cited dissatisfaction with value.
Although the surveys had relatively small samples, they highlight a recurring concern: clients need reporting that shows more than an agency's best results.
I’ve worked in paid media and growth for DTC, e-commerce and SaaS brands for more than a decade.
Some of the accounts I manage have hundreds of campaigns running across multiple markets. There’s always a flattering number available if you look hard enough. What matters is whether it tells you something useful.
When I review an agency’s performance, I look at four things: the full account, the connection to actual sales, the reporting period, and access to the underlying data. Here’s how to check each one, using anonymized examples from client accounts.
1. Look at the whole account, not just the winners
Start by asking for blended performance across every campaign. A few campaigns will almost always outperform the rest, especially in a mature account. They’re worth studying, but they shouldn’t stand in for the entire business.
One home-brewing brand we work with has 208 campaigns across the US, Canada, Mexico and Brazil. Its eight best campaigns have generated lifetime returns of roughly 10 to 19 times ad spend.
Across the full account, however, the return was 4.31 times on $1.46 million in spend, or about $6.2 million in ad-attributed sales.
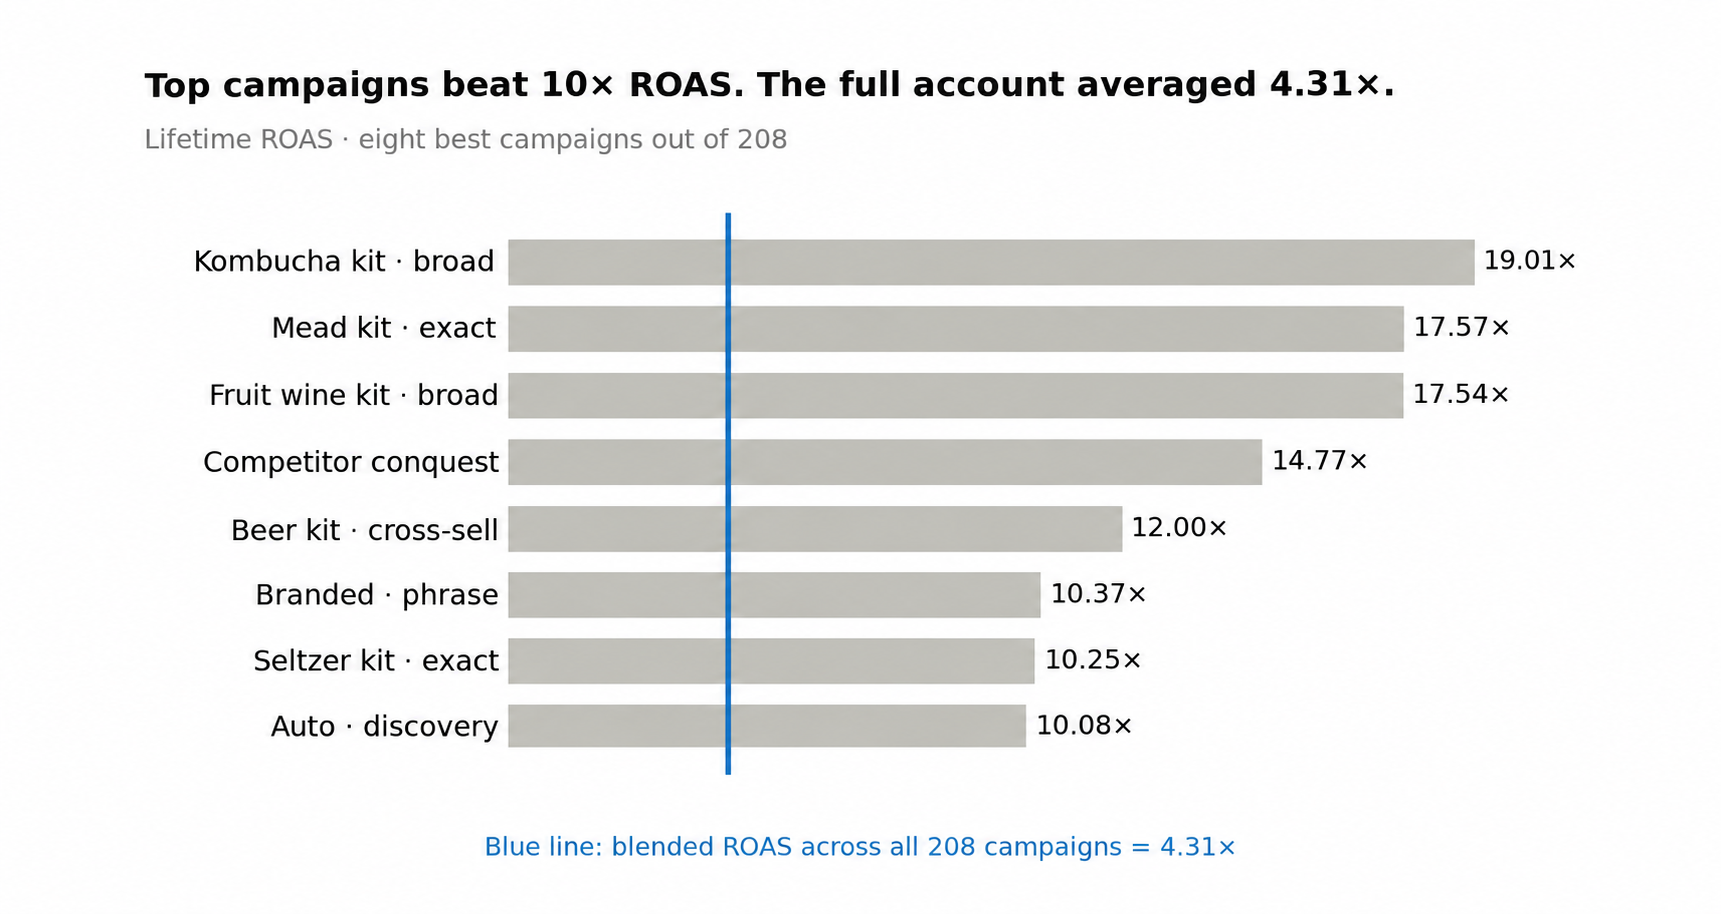
That 4.31 return is strong. It’s also a much more useful starting point than the 19-times campaign. Other campaigns are testing products, reaching new markets, or protecting branded searches. They still use budget, and their results belong in the conversation.
Ask to see total account ROAS, the share of spend going to campaigns below break-even, and the weakest campaigns alongside the strongest.
Make sure you know your break-even ROAS, too. With a 40% gross margin, the simplified break-even point before other expenses is 2.5 times.
A 3-times return may leave less room for profit than it first appears.
Watch for: a report that shows only top performers and never gives you an account-wide total.
2. Compare advertising results with actual revenue
Ad platforms are useful, but their revenue figures aren’t the same as your sales records. Google and Meta can both take credit for one order when a customer interacts with ads on both platforms.
ThoughtMetric documented an October 2025 example in which 66 of 3,566 orders had touchpoints on both.
Those orders generated $10,547, while the two platforms together attributed $21,093 to themselves.
A simple first check is to compare platform-attributed sales with store revenue over the same period.
If the combined platform figures exceed actual revenue, you know those numbers cannot represent unique sales. Even when they don’t exceed revenue, attribution overlap can still exist.
I look at ROAS and TACoS together
ROAS divides ad-attributed sales by ad spend. It tells you how much revenue the advertising platform attributes to campaigns for every dollar spent.
TACoS divides ad spend by total sales and shows how much the business spends on advertising relative to its overall revenue.
They answer different questions, and you need both to understand how much advertising contributes and what it costs the business.
A brand could report improving ROAS while its overall sales remain flat. That might be a sign of more efficient advertising, but it could also indicate that the campaigns are capturing more credit for customers who were already going to buy.
For one premium baby-carrier brand, monthly sales grew from roughly $7,000 when we started in 2023 to more than $700,000 by March 2025.
During the scaling period, blended ROAS was 7.6 times, and TACoS reached 5.03%.
Taken together, those figures imply that ads were attributed roughly 38% of revenue while advertising cost about five cents per dollar of total sales.
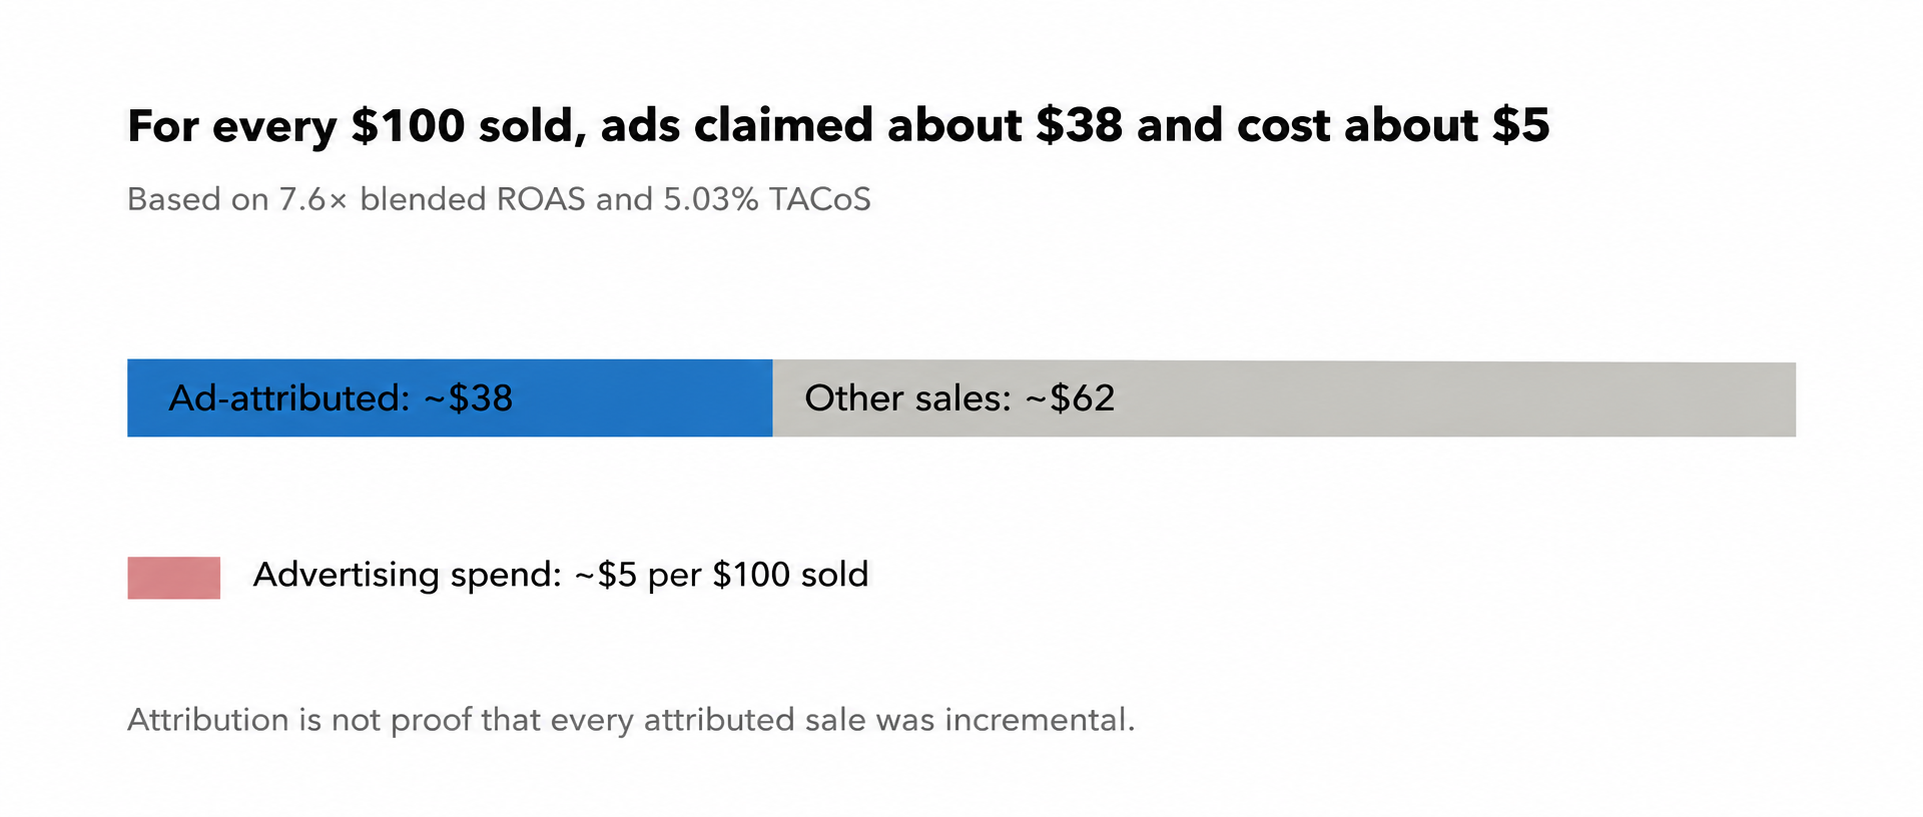
The other sales came through channels such as organic search, email, repeat purchases, and marketplace demand.
That’s why I care about the broader sales picture. If ROAS improves but overall revenue doesn’t move, I want to know whether ads are increasingly claiming existing demand, particularly through branded search or retargeting.
A practical way to improve reporting is to reconcile three separate sources: advertising platform reports, website analytics and the business's actual sales records.
These sources won't always match exactly, and they shouldn't be forced to. Their differences are often useful because they reveal where measurement assumptions, attribution rules, or tracking limitations affect the story.
Ask your agency: Can you explain the difference between platform-attributed revenue and actual business revenue? Which system is the source of truth for completed sales? Are returns, cancellations and discounts treated consistently?
If they can show ROAS but not what the business sold, the report is incomplete.
3. Check whether the result holds up over time
A short reporting window can make an ordinary campaign look exceptional, or make a good campaign look disappointing. This is especially common in businesses with seasonal demand or high-value purchases.
A luxury pool-furniture brand tested advertising during a slow December period. Over 22 days, $1,895 in spend produced $17,154 in attributed sales, a 9.05-times return. But those sales weren’t evenly distributed. One day brought in about $5,100, and two days near the end accounted for another $6,900.
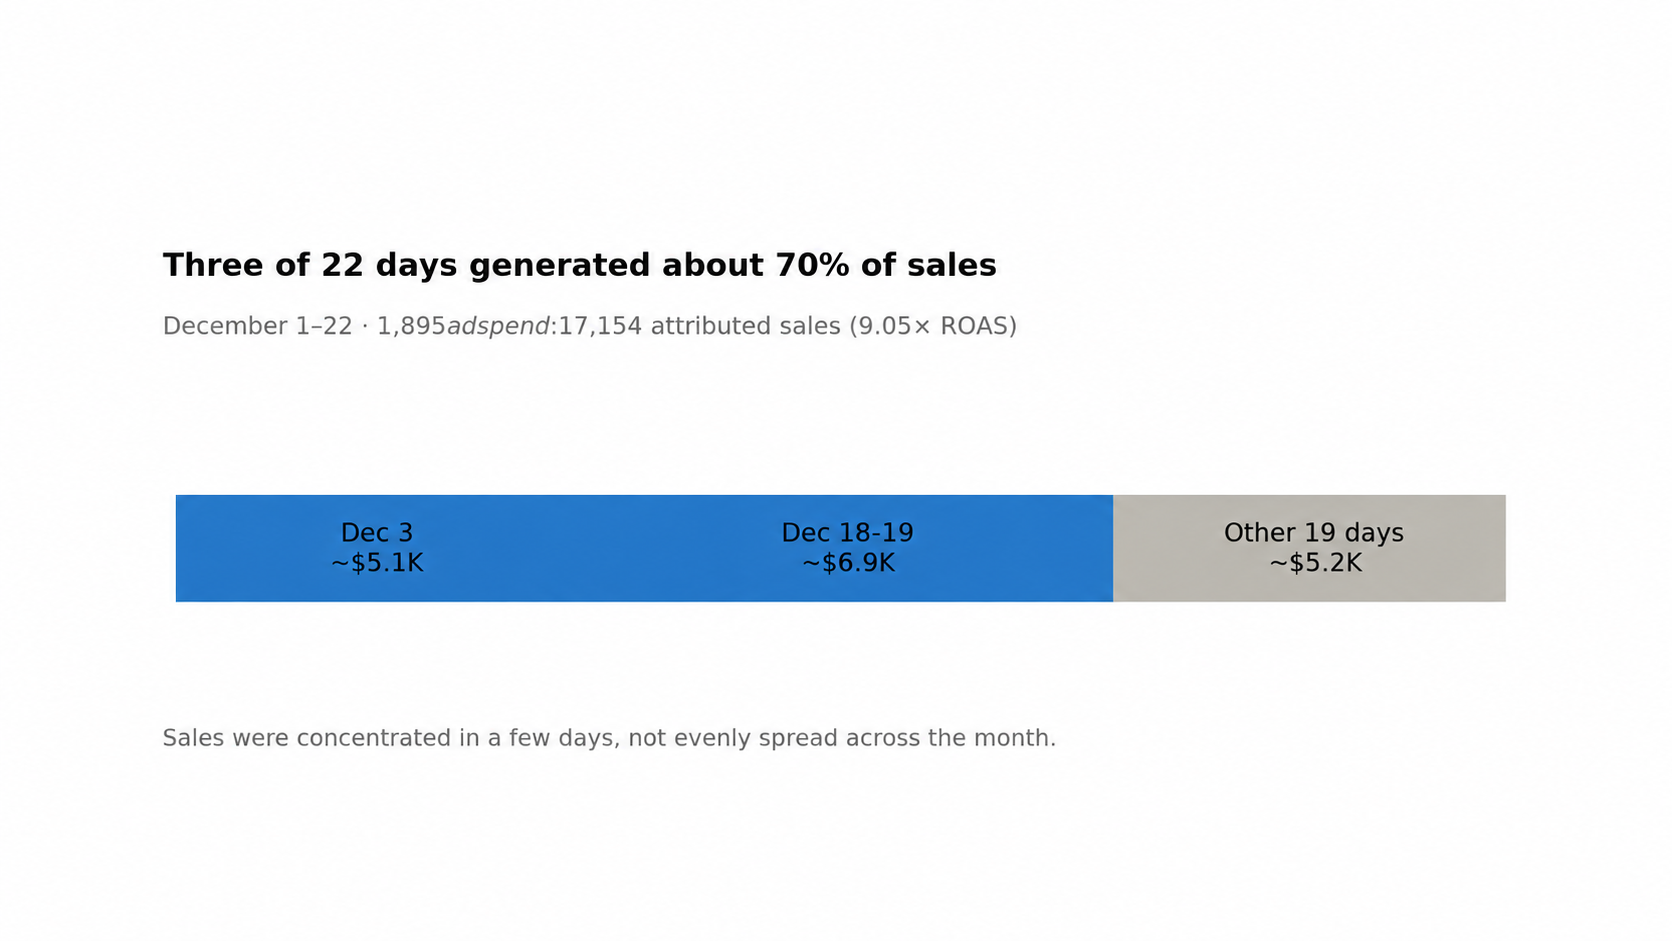
If you looked only at the strongest days, the campaign would appear almost unbelievable. If you looked at the quiet stretch between them, you might conclude it wasn’t working.
Neither view would capture what happened across the full test. And I wouldn’t use those 22 days to project an entire year.
Seasonality matters just as much. The home-brewing account typically generated $130,000 to $200,000 in monthly sales, but December reached $493,000.
Comparing December with November would make almost any year-end report look fantastic.
Comparing it with the prior December, and reviewing the following months, tells you much more. In this case, the post-holiday baseline settled at about $200,000 a month.
Ask for consistent date ranges, year-over-year comparisons, and at least 13 months of history where available. A best-week screenshot should never replace a full-period result.
4. Make sure you can check the numbers yourself
You should not have to wait for a monthly presentation to find out how your marketing is performing. You should also have access to the accounts generating the data.
Check who created your Google Ads account and whether you have administrator access. Google distinguishes between accounts created by a manager and accounts later linked to one, so it’s worth understanding the setup. Do the same for Meta, Google Analytics, Search Console and your e-commerce platform.
At Carazo Creative, clients have access to a live reporting portal with the same underlying performance information we use internally, including campaigns that need work. That doesn’t replace discussion or analysis. It means clients can review the numbers between meetings and compare them with their own accounts.
It’s also important to agree on definitions. What counts as a conversion? Is it a purchase, a lead or an add-to-cart event? What attribution window is being used? If those settings change, results may look different even when the business hasn’t improved.
Ask whether you can export campaign data, view performance without requesting a report and verify conversion definitions. If every question requires the agency to send another screenshot, you don’t have enough visibility.
A quick checklist for your next agency review
Test | Ask for | Passes if | Warning sign |
Full account | Blended ROAS and all campaigns | Account-wide results, compared with break-even | Only winning campaigns appear |
Business results | Total revenue, ad spend and TACoS | Advertising results can be compared with actual sales | ROAS appears without total revenue |
Time period | Consistent periods, prior year and 13-month trend | Seasonality and changes in baseline are clear | Selected weeks or shifting date ranges |
Access | Admin access, live dashboard and exports | You can independently check the underlying data | Only agency-prepared reports are available |
You don’t need every campaign to be profitable or every month to set a record. You need enough information to decide what to keep funding, what to change, and what to stop.
An agency should be comfortable showing you the disappointing numbers as well as the impressive ones. In my experience, those are often the numbers that lead to the best decisions.
Sources
ASK BOSCO / OnePoll, State of Marketing Reporting (January 2025; survey of 100 UK marketing managers).
Everything PR, The CMO–Agency Trust Gap 2026 (citing Setup’s Marketing Relationship Survey).
ThoughtMetric, Why Google and Meta Take Credit for the Same Sale.
Accelerated Digital Media, How In-Platform Reporting Compares to Real Results.
Google Ads Help, About ownership of client accounts.
Carazo Creative client account data, anonymized by industry.
Latest posts
View all posts →
Retention Stages: How Growth Teams Spot Users Before They Leave
Most growth dashboards still lead with a single retention curve. It starts at 100% on day zero, falls hard in the first week and flattens somewhere uncomfortab…

The Localization Failure Index: What AI Translation Disagreement Reveals About Business Localization Risk
Most growth teams do not treat translation as a major workflow decision until something breaks. A campaign needs to launch in three markets, a pricing page has…

AI Search Is a Growth Channel Now. Here Is the Framework to Treat It Like One.
Growth marketers adopted every channel early: paid social before it was crowded, content before every company had a blog, community before it became a job titl…